Ctrl+K
Iris 3.7.1 documentation - Home
  • Getting Started
  • User Guide
  • Developers Guide
  • Community
  • What’s New in Iris
  • Iris API
  • GitHub
  • Twitter
  • GitHub Discussions
  • PyPI
  • Conda
  • Getting Started
  • User Guide
  • Developers Guide
  • Community
  • What’s New in Iris
  • Iris API
  • GitHub
  • Twitter
  • GitHub Discussions
  • PyPI
  • Conda
Ctrl+K

Section Navigation

  • Why Iris
  • Installing
  • Gallery
    • General
    • Meteorology
    • Oceanography
      • Tri-Polar Grid Projected Plotting
      • Load a Time Series of Data From the NEMO Model
      • Oceanographic Profiles and T-S Diagrams
  • Getting Started
  • Gallery
  • Oceanography

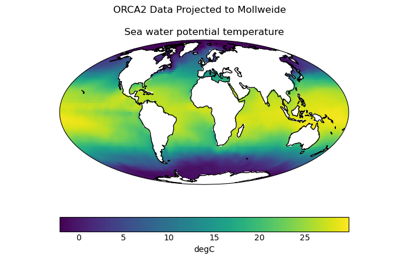
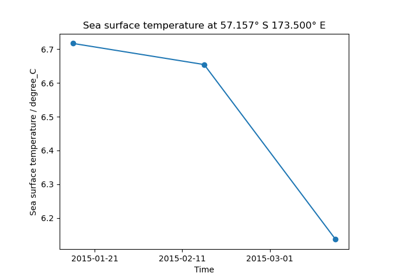
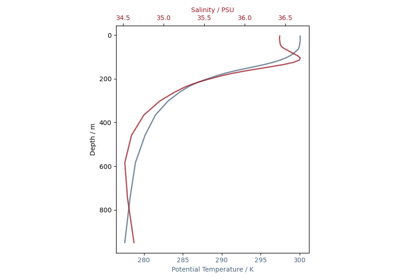
Oceanography#

Tri-Polar Grid Projected Plotting

Tri-Polar Grid Projected Plotting

Load a Time Series of Data From the NEMO Model

Load a Time Series of Data From the NEMO Model

Oceanographic Profiles and T-S Diagrams

Oceanographic Profiles and T-S Diagrams

previous

Global Average Annual Temperature Maps

next

Tri-Polar Grid Projected Plotting

Edit on GitHub
Show Source

© Copyright 2010 - 2024, Iris Contributors.

Created using Sphinx 5.3.0.

Built using Python 3.11.8.