Note
Click here to download the full example code
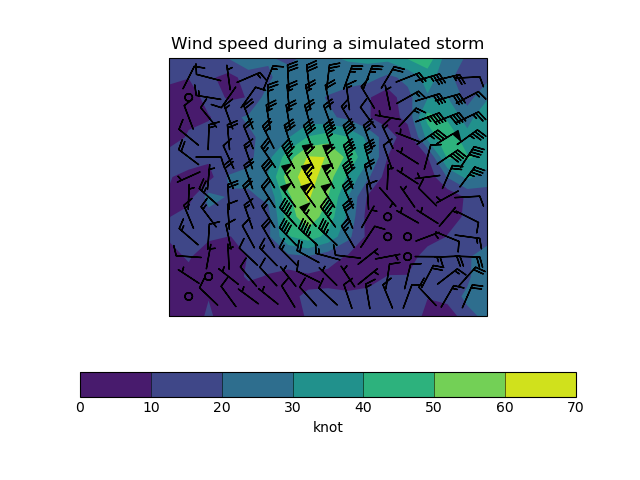
Plotting Wind Direction Using Barbs
This example demonstrates using barbs to plot wind speed contours and wind direction barbs from wind vector component input data. The vector components are co-located in space in this case.
The magnitude of the wind in the original data is low and so doesn’t illustrate the full range of barbs. The wind is scaled to simulate a storm that better illustrates the range of barbs that are available.
import matplotlib.pyplot as plt

import iris
import iris.plot as iplt
import iris.quickplot as qplt


def main():
    # Load the u and v components of wind from a pp file
    infile = iris.sample_data_path("wind_speed_lake_victoria.pp")

    uwind = iris.load_cube(infile, "x_wind")
    vwind = iris.load_cube(infile, "y_wind")

    uwind.convert_units("knot")
    vwind.convert_units("knot")

    # To illustrate the full range of barbs, scale the wind speed up to pretend
    # that a storm is passing over
    magnitude = (uwind ** 2 + vwind ** 2) ** 0.5
    magnitude.convert_units("knot")
    max_speed = magnitude.collapsed(
        ("latitude", "longitude"), iris.analysis.MAX
    ).data
    max_desired = 65

    uwind = uwind / max_speed * max_desired
    vwind = vwind / max_speed * max_desired

    # Create a cube containing the wind speed
    windspeed = (uwind ** 2 + vwind ** 2) ** 0.5
    windspeed.rename("windspeed")
    windspeed.convert_units("knot")

    plt.figure()

    # Plot the wind speed as a contour plot
    qplt.contourf(windspeed)

    # Add wind barbs except for the outermost values which overhang the edge
    # of the plot if left
    iplt.barbs(uwind[1:-1, 1:-1], vwind[1:-1, 1:-1], pivot="middle", length=6)

    plt.title("Wind speed during a simulated storm")
    qplt.show()


if __name__ == "__main__":
    main()
Total running time of the script: ( 0 minutes 0.192 seconds)