Note
Go to the end to download the full example code.
Cross Section Plots#
How to visualise cross-sections of multi-dimensional Cubes. |
Tags: topic_plotting | topic_slice_combine
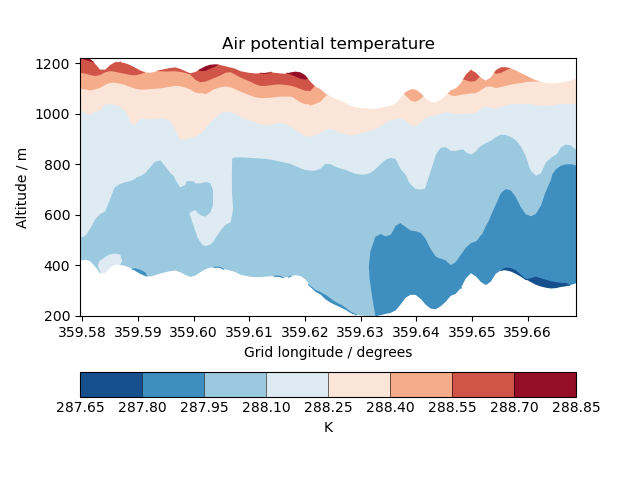
This example demonstrates contour plots of a cross-sectioned multi-dimensional cube which features a hybrid height vertical coordinate system.
import matplotlib.pyplot as plt
import iris
import iris.plot as iplt
import iris.quickplot as qplt
def main():
# Load some test data.
fname = iris.sample_data_path("hybrid_height.nc")
theta = iris.load_cube(fname, "air_potential_temperature")
# Extract a single height vs longitude cross-section. N.B. This could
# easily be changed to extract a specific slice, or even to loop over *all*
# cross section slices.
cross_section = next(theta.slices(["grid_longitude", "model_level_number"]))
qplt.contourf(cross_section, coords=["grid_longitude", "altitude"], cmap="RdBu_r")
iplt.show()
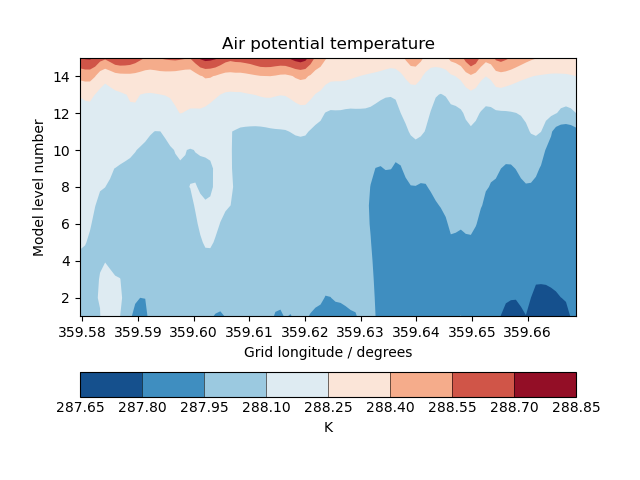
# Now do the equivalent plot, only against model level
plt.figure()
qplt.contourf(
cross_section,
coords=["grid_longitude", "model_level_number"],
cmap="RdBu_r",
)
iplt.show()
if __name__ == "__main__":
main()
Total running time of the script: (0 minutes 0.200 seconds)