Note
Go to the end to download the full example code.
Loading a Cube From a Custom File Format#
How to visualise data from a file Iris does not natively support. |
Tags: topic_plotting | topic_load_save
This example shows how a custom text file can be loaded using the standard Iris load mechanism.
The first stage in the process is to define an Iris FormatSpecification for the file format. To create a
format specification we need to define the following:
format_name - Some text that describes the format specification we are creating
file_element - FileElement object describing the element which identifies this FormatSpecification.
Possible values are:
iris.io.format_picker.MagicNumber(n, o)The n bytes from the file at offset o.
iris.io.format_picker.FileExtension()The file extension.
iris.io.format_picker.LeadingLine()The first line of the file.
file_element_value - The value that the file_element should take if a file matches this FormatSpecification
handler (optional) - A generator function that will be called when the file specification has been identified. This function is provided by the user and provides the means to parse the whole file. If no handler function is provided, then identification is still possible without any handling.
The handler function must define the following arguments:
list of filenames to process
callback function - An optional function to filter/alter the Iris cubes returned
The handler function must be defined as generator which yields each cube as they are produced.
priority (optional) - Integer giving a priority for considering this specification where higher priority means sooner consideration
In the following example, the function load_NAME_III() has been defined
to handle the loading of the raw data from the custom file format. This
function is called from NAME_to_cube() which uses this data to create and
yield Iris cubes.
In the main() function the filenames are loaded via the iris.load_cube
function which automatically invokes the FormatSpecification we defined.
The cube returned from the load function is then used to produce a plot.
import datetime
from cf_units import CALENDAR_STANDARD, Unit
import matplotlib.pyplot as plt
import numpy as np
import iris
import iris.coord_systems as icoord_systems
import iris.coords as icoords
import iris.fileformats
import iris.io.format_picker as format_picker
import iris.plot as iplt
UTC_format = "%H%M%Z %d/%m/%Y"
FLOAT_HEADERS = [
"X grid origin",
"Y grid origin",
"X grid resolution",
"Y grid resolution",
]
INT_HEADERS = ["X grid size", "Y grid size", "Number of fields"]
DATE_HEADERS = ["Run time", "Start of release", "End of release"]
COLUMN_NAMES = [
"species_category",
"species",
"cell_measure",
"quantity",
"unit",
"z_level",
"time",
]
def load_NAME_III(filename):
"""Load the Met Office's NAME III grid output files.
Loads the Met Office's NAME III grid output files returning headers, column
definitions and data arrays as 3 separate lists.
"""
# Loading a file gives a generator of lines which can be progressed using
# the next() function. This will come in handy as we wish to progress
# through the file line by line.
with open(filename) as file_handle:
# Define a dictionary which can hold the header metadata for this file.
headers = {}
# Skip the NAME header of the file which looks something like
# 'NAME III (version X.X.X)'.
next(file_handle)
# Read the next 16 lines of header information, putting the form
# "header name: header value" into a dictionary.
for _ in range(16):
header_name, header_value = next(file_handle).split(":")
# Strip off any spurious space characters in the header name and
# value.
header_name = header_name.strip()
header_value = header_value.strip()
# Cast some headers into floats or integers if they match a given
# header name.
if header_name in FLOAT_HEADERS:
header_value = float(header_value)
elif header_name in INT_HEADERS:
header_value = int(header_value)
elif header_name in DATE_HEADERS:
# convert the time to python datetimes
header_value = datetime.datetime.strptime(header_value, UTC_format)
headers[header_name] = header_value
# Skip the next blank line in the file.
next(file_handle)
# Read the next 7 lines of column definitions.
column_headings = {}
for column_header_name in COLUMN_NAMES:
column_headings[column_header_name] = [
col.strip() for col in next(file_handle).split(",")
][:-1]
# Convert the time to python datetimes.
new_time_column_header = []
for i, t in enumerate(column_headings["time"]):
# The first 4 columns aren't time at all, so don't convert them to
# datetimes.
if i >= 4:
t = datetime.datetime.strptime(t, UTC_format)
new_time_column_header.append(t)
column_headings["time"] = new_time_column_header
# Skip the blank line after the column headers.
next(file_handle)
# Make a list of data arrays to hold the data for each column.
data_shape = (headers["Y grid size"], headers["X grid size"])
data_arrays = [
np.zeros(data_shape, dtype=np.float32)
for i in range(headers["Number of fields"])
]
# Iterate over the remaining lines which represent the data in a column
# form.
for line in file_handle:
# Split the line by comma, removing the last empty column caused by
# the trailing comma.
vals = line.split(",")[:-1]
# Cast the x and y grid positions to floats and convert them to
# zero based indices (the numbers are 1 based grid positions where
# 0.5 represents half a grid point.)
x = int(float(vals[0]) - 1.5)
y = int(float(vals[1]) - 1.5)
# Populate the data arrays (i.e. all columns but the leading 4).
for i, data_array in enumerate(data_arrays):
data_array[y, x] = float(vals[i + 4])
return headers, column_headings, data_arrays
def NAME_to_cube(filenames, callback):
"""Return a generator of cubes given a list of filenames and a callback."""
for filename in filenames:
header, column_headings, data_arrays = load_NAME_III(filename)
for i, data_array in enumerate(data_arrays):
# turn the dictionary of column headers with a list of header
# information for each field into a dictionary of headers for just
# this field. Ignore the first 4 columns of grid position (data was
# located with the data array).
field_headings = dict((k, v[i + 4]) for k, v in column_headings.items())
# make an cube
cube = iris.cube.Cube(data_array)
# define the name and unit
name = "%s %s" % (
field_headings["species"],
field_headings["quantity"],
)
name = name.upper().replace(" ", "_")
cube.rename(name)
# Some units are badly encoded in the file, fix this by putting a
# space in between. (if gs is not found, then the string will be
# returned unchanged)
cube.units = field_headings["unit"].replace("gs", "g s")
# define and add the singular coordinates of the field (flight
# level, time etc.)
cube.add_aux_coord(
icoords.AuxCoord(
field_headings["z_level"],
long_name="flight_level",
units="1",
)
)
# define the time unit and use it to serialise the datetime for the
# time coordinate
time_unit = Unit("hours since epoch", calendar=CALENDAR_STANDARD)
time_coord = icoords.AuxCoord(
time_unit.date2num(field_headings["time"]),
standard_name="time",
units=time_unit,
)
cube.add_aux_coord(time_coord)
# build a coordinate system which can be referenced by latitude and
# longitude coordinates
lat_lon_coord_system = icoord_systems.GeogCS(6371229)
# build regular latitude and longitude coordinates which have
# bounds
start = header["X grid origin"] + header["X grid resolution"]
step = header["X grid resolution"]
count = header["X grid size"]
pts = start + np.arange(count, dtype=np.float32) * step
lon_coord = icoords.DimCoord(
pts,
standard_name="longitude",
units="degrees",
coord_system=lat_lon_coord_system,
)
lon_coord.guess_bounds()
start = header["Y grid origin"] + header["Y grid resolution"]
step = header["Y grid resolution"]
count = header["Y grid size"]
pts = start + np.arange(count, dtype=np.float32) * step
lat_coord = icoords.DimCoord(
pts,
standard_name="latitude",
units="degrees",
coord_system=lat_lon_coord_system,
)
lat_coord.guess_bounds()
# add the latitude and longitude coordinates to the cube, with
# mappings to data dimensions
cube.add_dim_coord(lat_coord, 0)
cube.add_dim_coord(lon_coord, 1)
# implement standard iris callback capability. Although callbacks
# are not used in this example, the standard mechanism for a custom
# loader to implement a callback is shown:
cube = iris.io.run_callback(
callback, cube, [header, field_headings, data_array], filename
)
# yield the cube created (the loop will continue when the next()
# element is requested)
yield cube
# Create a format_picker specification of the NAME file format giving it a
# priority greater than the built in NAME loader.
_NAME_III_spec = format_picker.FormatSpecification(
"Name III",
format_picker.LeadingLine(),
lambda line: line.startswith(b"NAME III"),
NAME_to_cube,
priority=6,
)
# Register the NAME loader with iris
iris.fileformats.FORMAT_AGENT.add_spec(_NAME_III_spec)
# ---------------------------------------------
# | Using the new loader |
# ---------------------------------------------
def main():
fname = iris.sample_data_path("NAME_output.txt")
boundary_volc_ash_constraint = iris.Constraint(
"VOLCANIC_ASH_AIR_CONCENTRATION", flight_level="From FL000 - FL200"
)
# Callback shown as None to illustrate where a cube-level callback function
# would be used if required
cube = iris.load_cube(fname, boundary_volc_ash_constraint, callback=None)
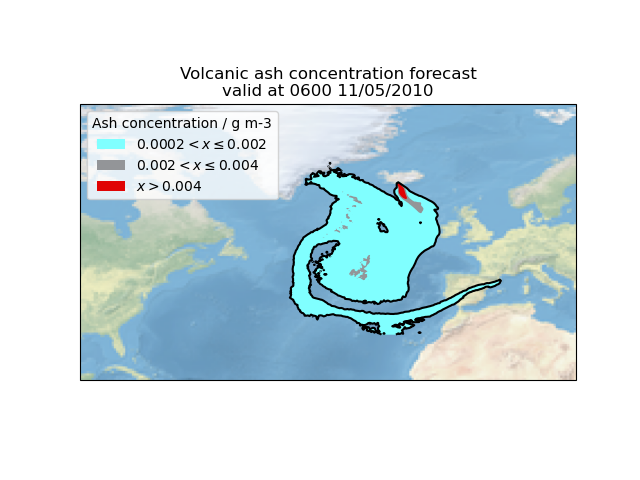
# draw contour levels for the data (the top level is just a catch-all)
levels = (0.0002, 0.002, 0.004, 1e10)
cs = iplt.contourf(
cube,
levels=levels,
colors=("#80ffff", "#939598", "#e00404"),
)
# draw a black outline at the lowest contour to highlight affected areas
iplt.contour(cube, levels=(levels[0], 100), colors="black")
# set an extent and a background image for the map
ax = plt.gca()
ax.set_extent((-90, 20, 20, 75))
ax.stock_img("ne_shaded")
# make a legend, with custom labels, for the coloured contour set
artists, _ = cs.legend_elements()
labels = [
r"$%s < x \leq %s$" % (levels[0], levels[1]),
r"$%s < x \leq %s$" % (levels[1], levels[2]),
r"$x > %s$" % levels[2],
]
ax.legend(artists, labels, title="Ash concentration / g m-3", loc="upper left")
time = cube.coord("time")
time_date = time.units.num2date(time.points[0]).strftime(UTC_format)
plt.title("Volcanic ash concentration forecast\nvalid at %s" % time_date)
iplt.show()
if __name__ == "__main__":
main()
Total running time of the script: (0 minutes 0.870 seconds)