Note
Go to the end to download the full example code.
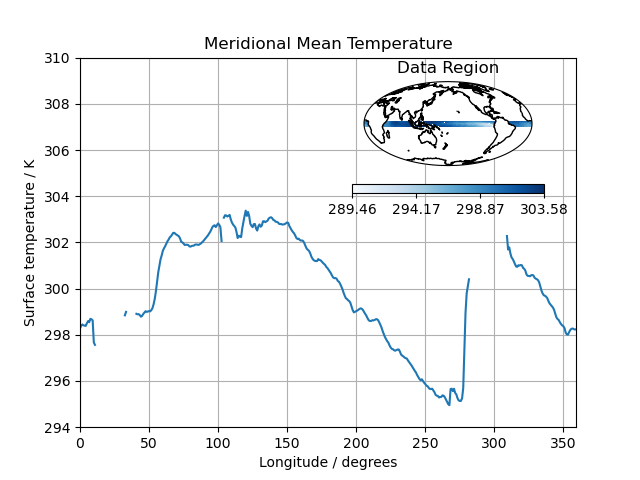
Test Data Showing Inset Plots#
How to create inset plots within a main plot. |
Tags: topic_plotting | topic_maths_stats
This example demonstrates the use of a single 3D data cube with time, latitude and longitude dimensions to plot a temperature series for a single latitude coordinate, with an inset plot of the data region.
import cartopy.crs as ccrs
import matplotlib.pyplot as plt
import numpy as np

import iris
import iris.plot as iplt
import iris.quickplot as qplt


def main():
    cube1 = iris.load_cube(iris.sample_data_path("ostia_monthly.nc"))
    # Slice into cube to retrieve data for the inset map showing the
    # data region
    region = cube1[-1, :, :]
    # Average over latitude to reduce cube to 1 dimension
    plot_line = region.collapsed("latitude", iris.analysis.MEAN)

    # Open a window for plotting
    fig = plt.figure()
    # Add a single subplot (axes). Could also use "ax_main = plt.subplot()"
    ax_main = fig.add_subplot(1, 1, 1)
    # Produce a quick plot of the 1D cube
    qplt.plot(plot_line)

    # Set x limits to match the data
    ax_main.set_xlim(0, plot_line.coord("longitude").points.max())
    # Adjust the y limits so that the inset map won't clash with main plot
    ax_main.set_ylim(294, 310)
    ax_main.set_title("Meridional Mean Temperature")
    # Add grid lines
    ax_main.grid()

    # Add a second set of axes specifying the fractional coordinates within
    # the figure with bottom left corner at x=0.55, y=0.58 with width
    # 0.3 and height 0.25.
    # Also specify the projection
    ax_sub = fig.add_axes(
        [0.55, 0.58, 0.3, 0.25],
        projection=ccrs.Mollweide(central_longitude=180),
    )

    # Use iris.plot (iplt) here so colour bar properties can be specified
    # Also use a sequential colour scheme to reduce confusion for those with
    # colour-blindness
    iplt.pcolormesh(region, cmap="Blues")
    # Manually set the orientation and tick marks on your colour bar
    ticklist = np.linspace(np.min(region.data), np.max(region.data), 4)
    plt.colorbar(orientation="horizontal", ticks=ticklist)
    ax_sub.set_title("Data Region")
    # Add coastlines
    ax_sub.coastlines()
    # request to show entire map, using the colour mesh on the data region only
    ax_sub.set_global()

    qplt.show()


if __name__ == "__main__":
    main()
Total running time of the script: (0 minutes 0.250 seconds)