Note
Go to the end to download the full example code.
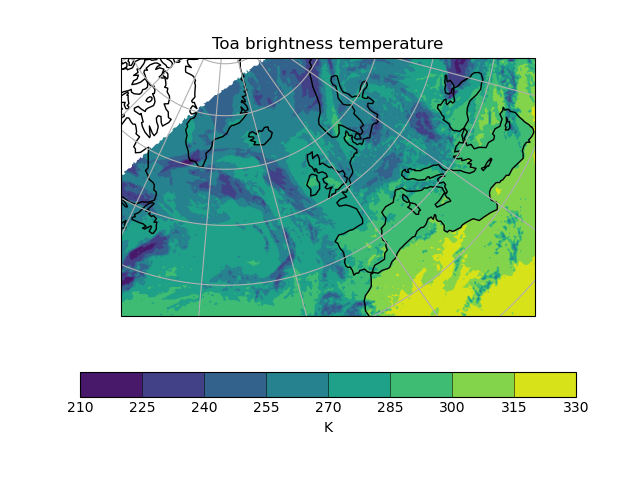
Example of a Polar Stereographic Plot#
A demonstration of plotting data defined on an alternative map projection. |
Tags: topic_plotting
Demonstrates plotting data that are defined on a polar stereographic projection.
import matplotlib.pyplot as plt

import iris
import iris.plot as iplt
import iris.quickplot as qplt


def main():
    file_path = iris.sample_data_path("toa_brightness_stereographic.nc")
    cube = iris.load_cube(file_path)
    qplt.contourf(cube)
    ax = plt.gca()
    ax.coastlines()
    ax.gridlines()
    iplt.show()


if __name__ == "__main__":
    main()
Total running time of the script: (0 minutes 1.410 seconds)