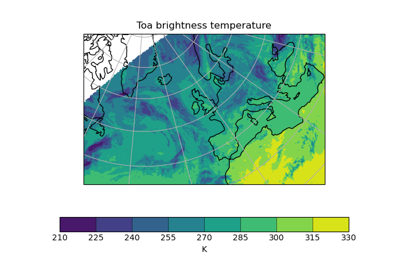
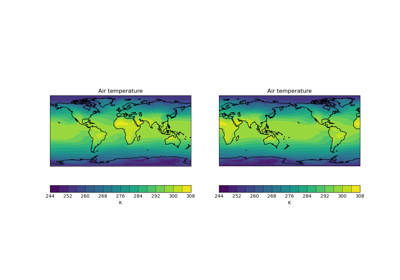
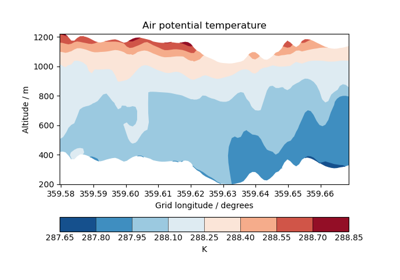
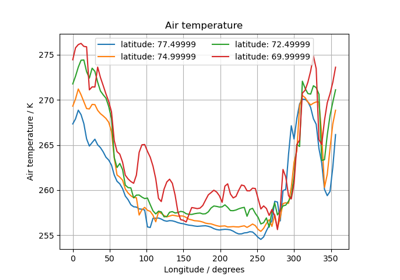
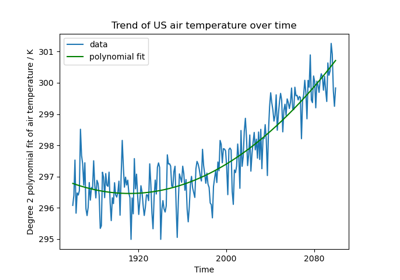
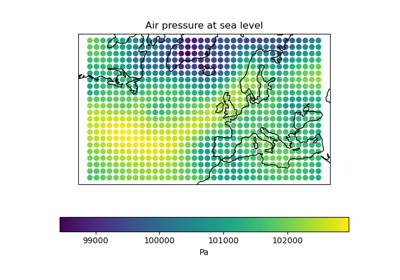
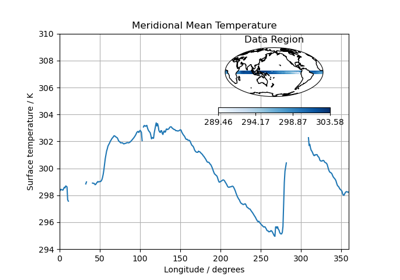
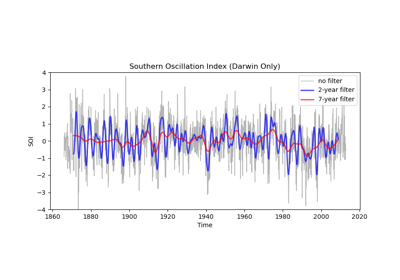
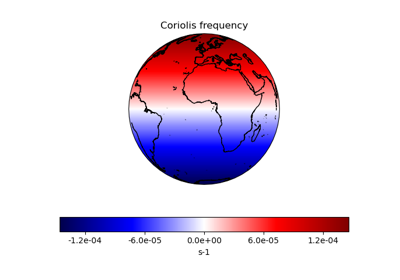
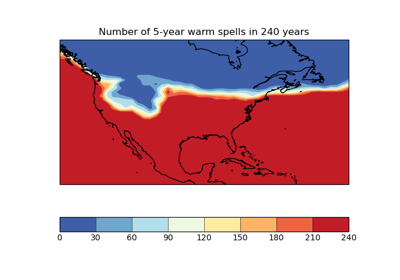
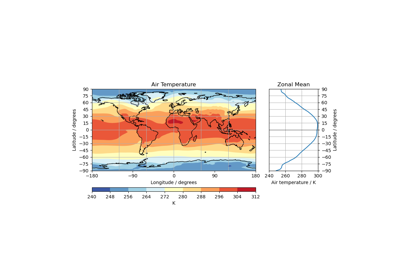
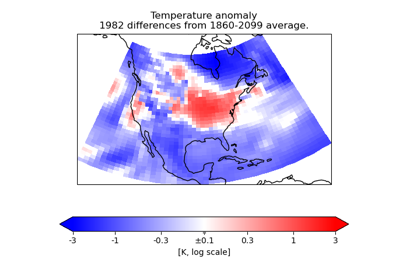
General# Example of a Polar Stereographic Plot Example of a Polar Stereographic Plot Quickplot of a 2D Cube on a Map Quickplot of a 2D Cube on a Map Cross Section Plots Cross Section Plots Multi-Line Temperature Profile Plot Multi-Line Temperature Profile Plot Fitting a Polynomial Fitting a Polynomial Rotated Pole Mapping Rotated Pole Mapping Test Data Showing Inset Plots Test Data Showing Inset Plots Applying a Filter to a Time-Series Applying a Filter to a Time-Series Deriving the Coriolis Frequency Over the Globe Deriving the Coriolis Frequency Over the Globe Calculating a Custom Statistic Calculating a Custom Statistic Zonal Mean Diagram of Air Temperature Zonal Mean Diagram of Air Temperature Colouring Anomaly Data With Logarithmic Scaling Colouring Anomaly Data With Logarithmic Scaling Plotting in Different Projections Plotting in Different Projections Loading a Cube From a Custom File Format Loading a Cube From a Custom File Format