Note
Go to the end to download the full example code.
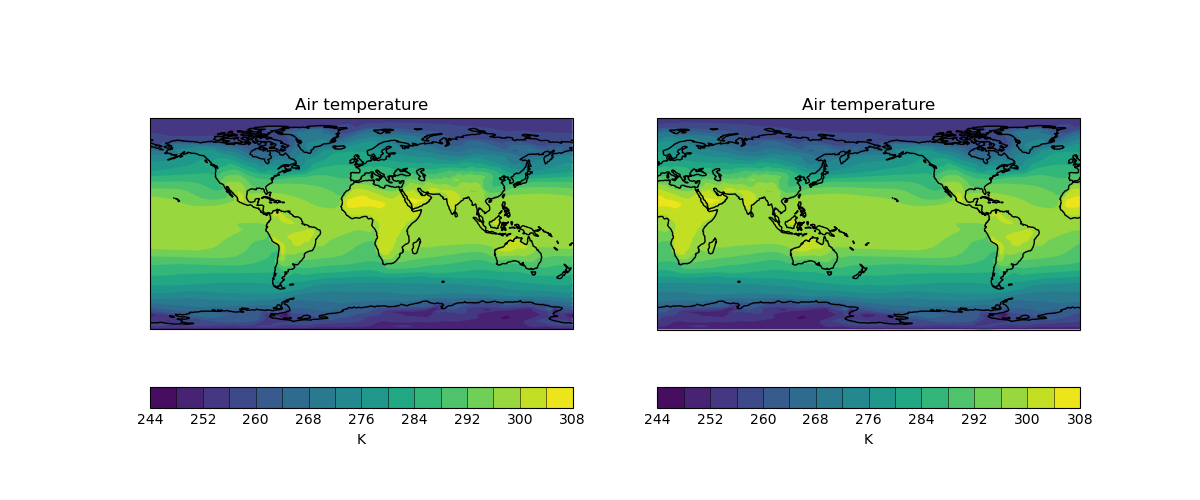
Quickplot of a 2D Cube on a Map#
A demonstration of basic iris.quickplot use. |
Tags: topic_plotting
This example demonstrates a contour plot of global air temperature. The plot title and the labels for the axes are automatically derived from the metadata.
import cartopy.crs as ccrs
import matplotlib.pyplot as plt

import iris
import iris.plot as iplt
import iris.quickplot as qplt


def main():
    fname = iris.sample_data_path("air_temp.pp")
    temperature = iris.load_cube(fname)

    # Plot #1: contourf with axes longitude from -180 to 180
    plt.figure(figsize=(12, 5))
    plt.subplot(121)
    qplt.contourf(temperature, 15)
    plt.gca().coastlines()

    # Plot #2: contourf with axes longitude from 0 to 360
    proj = ccrs.PlateCarree(central_longitude=-180.0)
    plt.subplot(122, projection=proj)
    qplt.contourf(temperature, 15)
    plt.gca().coastlines()
    iplt.show()


if __name__ == "__main__":
    main()
Total running time of the script: (0 minutes 0.537 seconds)