Gallery#
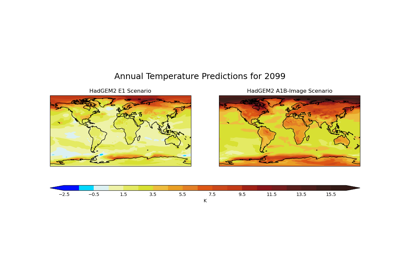
The gallery is divided into sections as described below. All entries show the code used to produce the example plot. Additionally there are links to download the code directly as source or as part of a jupyter notebook, these links are at the bottom of the page.
In order to successfully view the jupyter notebook locally so you may
experiment with the code you will need an environment setup with the
appropriate dependencies, see Installing for instructions.
Ensure that iris-sample-data is installed as it is used in the gallery.
Additionally ensure that you install jupyter. The command to install both
is:
conda install -c conda-forge iris-sample-data jupyter
Once you have downloaded the notebooks (bottom of each gallery page), you may start the jupyter notebook via:
jupyter notebook
If you wish to contribute to the gallery see the Gallery section of the Contributing to the Documentation.
-3.10.0.dev18-gold?style=flat)
